S3 Load and transformation🔗
In this example, we take a look at a basic pipeline that can be created in Designer, utilizing both orchestration and transformation pipelines with a variety of components.
This example will load a set of commercial flights data from Amazon S3, filter it and use it to find which planes have traveled the farthest distance that year. The data has been preprocessed to some degree to reduce the number of columns and make the example easier to follow.
We will be discussing two pipelines that work together:
- Flights Slim: An orchestration pipeline that loads our slimmed-down flights data CSV from S3 into a Snowflake table.
- Flights Slim Trans: A transformation pipeline that filters, aggregates, and ranks our data.
To follow along with this example, you require access to an Amazon S3 bucket and a valid Snowflake connection in Maia. In many parts of this example, we will be pointing components to the correct Snowflake warehouse, database, and schema, but it is a good idea to have your default environment set up with these in mind so default values can be used.
The data🔗
Our example data can be found at the link below and should be uploaded to your S3 bucket.
It is a comma-delimited CSV with a single header line. This will need to be accounted for in the S3 Load component configuration.
Orchestration🔗
The orchestration pipeline has the task of loading data from S3. We must begin by creating a Snowflake table for the data to land in, then load the data, before passing the workflow on to our transformation pipeline. The component order is as follows:
Start → Create Table → S3 Load → Run Transformation
Add components to the canvas by clicking the Add component icon on the left of the canvas. The components can be connected by clicking and dragging from one connection ring to another beside the components on the canvas.
Create Table🔗
The configuration of Create Table is given below. Many values do not need to be set by the user (can remain empty) and are omitted from this example.
- Name: The name of the component does not affect the pipeline at all. Call it something appropriate.
- Create/Replace: Replace.
- Database: The database we want our table to be created in.
- Schema: The schema we want our table to be created in.
- New Table Name: The name of our new table. It can be named anything you like, but we will need this information later.
- Table Type: Permanent.
- Columns: Our columns are defined as below.
| Column Name | Data Type | Size | Precision | Not Null | Unique |
|---|---|---|---|---|---|
| TailNum | VARCHAR | 255 | No | No | |
| ElapsedTime | NUMBER | 8 | 0 | No | No |
| AirTime | NUMBER | 8 | 0 | No | No |
| ArrDelay | NUMBER | 8 | 0 | No | No |
| DepDelay | NUMBER | 8 | 0 | No | No |
| Distance | NUMBER | 8 | 0 | No | No |
| Manufacturer | VARCHAR | 255 | No | No |
Remember to set the Not Null and Unique fields or the component may not validate. We have opted to Replace the table every run as this is commonly helpful when developing pipelines and changing the metadata as you go.
S3 Load🔗
The configuration of S3 Load is given below. Many values do not need to be set by the user (can remain empty) and are omitted from this example.
- Name: The name of the component does not affect the pipeline at all. Call it something appropriate.
- Stage: [Custom].
- Authentication: Credentials.
- S3 Object Prefix: The prefix for your S3 bucket. e.g.
s3//designer-data/. - Pattern: In this case, it should just be the path and name of the CSV file. e.g.
FlightsSlim.csv. - Encryption: None.
- Warehouse: The Snowflake warehouse we created our table in.
- Database: The database we created our table in.
- Schema: PUBLIC.
- Target Table: The name of the table we created with the Create Table component.
- Format: [Custom].
- File Type: CSV.
- Compression: AUTO.
- Skip Header: 1.
- Trim Space: False.
- Error on Column Count Mismatch: False.
- Empty Field as Null: True.
- Replace Invalid Characters: False.
- On Error: Continue.
- Purge Files: False.
- Truncate Columns: False.
- Force Load: False.
Many CSV-related fields are left blank as sensible defaults will be used. We've made sure to include a Skip Header of 1 to ignore the header row.
Note
S3 Load works by pattern matching files and loading them. It is entirely possible for the component to "succeed" without loading anything if no files match the input.
Finishing the pipeline🔗
This pipeline can now have a Run Transformation component attached if the transformation pipeline is available to be attached. Or it can be left as-is and run on its own. It is certainly worth running this pipeline alone at least once to create the table before attempting a data load and transformation.
Transformation🔗
Now we have our data ready to load, we can decide what to do with it. In this example, we'd like to find out which Boeing-made plane has scored the highest distance in the dataset and we'll need to prep the data to report that using the following components:
Table Input → Filter → Aggregate → Rank → Rewrite Table
As with the orchestration components, there are some properties that do not require input from the user for this example, and we will omit discussing these.
Table Input🔗
The Table Input component is simple enough. We point it to the table we created in the orchestration pipeline and it will bring that data into the workflow.
- Name: Give the component a sensible name.
- Database: The database your table was created in.
- Schema: The schema your table was created in.
- Target Table: The name of the table we created in the orchestration pipeline.
- Column Names: Choose the columns to bring into the workflow. The selection is populated automatically from the table data so it is useful to have run the orchestration pipeline and created the table before configuring this property.
Filter🔗
The Filter component allows us to keep only rows that match our defined criteria. In this case, we only want to keep rows where Boeing is the manufacturer.
Filter Conditions:
| Input Column | Qualifier | Comparator | Value |
|---|---|---|---|
| Manufacturer | Is | Equal to | BOEING |
Combine Conditions: AND
Aggregate🔗
Now we'll use an Aggregate component to add up the distance traveled by each plane. Planes are uniquely identified by their tail number so we can use the TailNum column to group the rows accordingly.
Groupings: TailNum
Aggregations:
| Source Column | Aggregation Type |
|---|---|
| Distance | Sum |
Grouping Type: Group By
This will considerably change how our data looks. Instead of almost 1000 rows, we will have under 500 as many journeys are grouped together as they belong to the same plane. Non-aggregated data doesn't make sense with such groupings, so we are left with only two columns:
- sum_Distance: The sum of distances belonging to each TailNum
- TailNum: Similar to our TailNum column before but since like-rows have been grouped, the values are now unique.
Rank🔗
To finish the transformation, we now want to rank the planes according to their distances traveled. The Rank component can also partition the data if we want to rank parts of it separately; for example, we could have ranked each manufacturer's planes separately. In this example, we will be ranking the entire remaining data, so we will leave the Partition Data property blank.
Include Input Columns: Yes
Ordering Within Partitions:
| Input Column | Ordering |
|---|---|
| sum_Distance | Descending |
Functions:
| Window Function | Output Column |
|---|---|
| Rank | Rank |
Rewrite Table🔗
Finally, we want to write this data out to a Snowflake table. The Rewrite Table component is the simplest way to achieve this, as it will create an appropriately configured table for us when it runs, and can be run repeatedly during development to see how changes affect the data.
- Warehouse: The Snowflake warehouse to create the output table in.
- Database: The database to create the output table in.
- Schema: The schema to create the output table in.
- Target Table: The desired output table name.
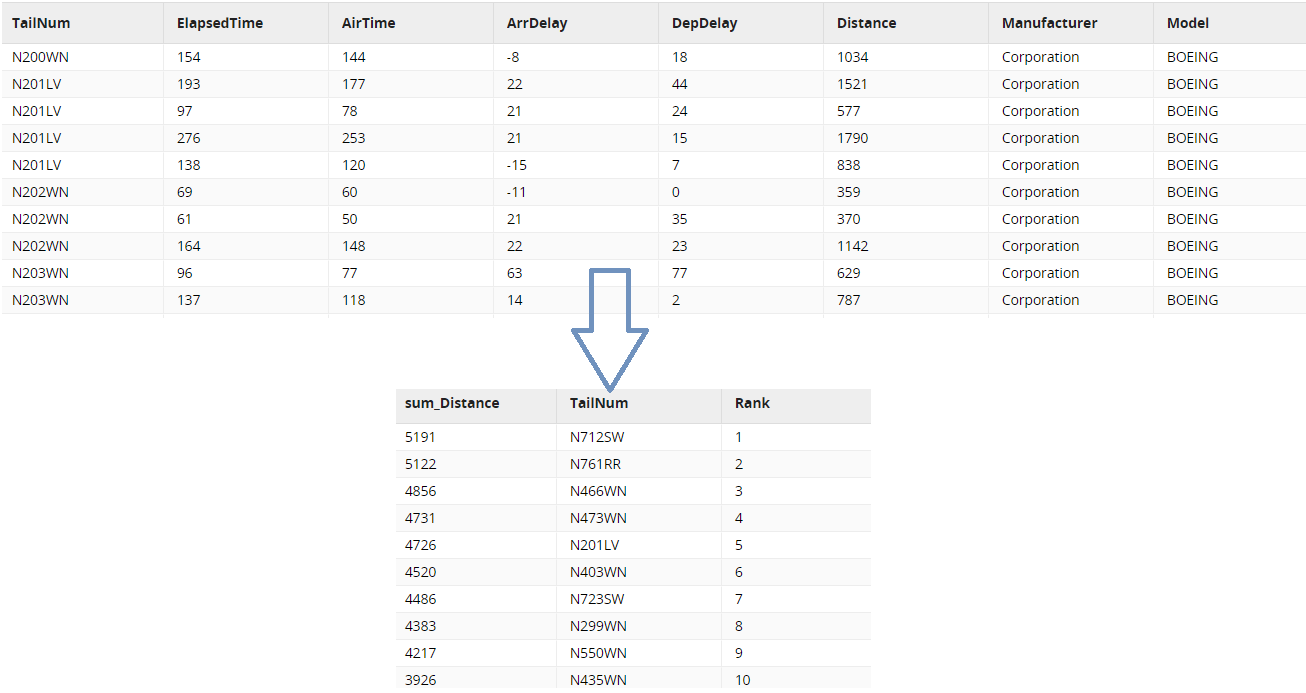
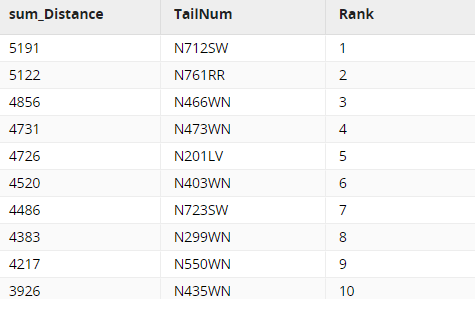
Running the example🔗
Once you're happy with your configurations, you can return to the orchestration pipeline, then right-click the canvas and select Run pipeline to let it run and see its progress in the Task history tab.
You can inspect the data by logging into your Snowflake account and accessing the table. Your transformation should have been changed as illustrated below.