Usage dashboard🔗
The usage dashboard is available to all Data Productivity Cloud customers and provides a detailed daily breakdown of your credit consumption.
Any users with the Billing service enabled on their user account can view a complete breakdown of the credits consumed by their account across the subscription duration, per day and per month.
Accessing the usage dashboard🔗
To access the usage dashboard, you need to register with the Data Productivity Cloud. Once you have logged into your Data Productivity Cloud account, access the dashboard through one of these methods:
- In the left navigation, click your Profile & Account icon. Then, select Credit usage in the menu.
- On the Data Productivity Cloud homepage, click the Monitor credit usage icon under Quicklinks.

Understanding the usage dashboard🔗
At the top of the page you will see your account and subscription plan details:
| Plan details | Further information |
|---|---|
| Edition type | This is the edition you're subscribed to. |
| Term | Trial, Monthly, and Contact. |
| Dates | The start and end dates according to your active subscription. |
| Total credits used | Your total used credits and any credit allowances. |
Additionally, if you're currently on the Enterprise trial edition, you will see a ribbon with the following options:

- Information about how many days are remaining in your trial period.
- Your remaining credits. Click View Breakdown to view a breakdown of your usage consumption during the selected month.
- View pricing: Opens the Choose your edition page which provides comprehensive information about each edition and subscription. You can explore each edition in detail by selecting the Show all features link to open the Compare features dialog. For more information, read Editions and Marketplace subscriptions, respectively.
- Talk to sales: Opens the Talk to an Expert page which lets you send a message to Matillion's Sales team. Ensure you include the appropriate email address and phone number for the response.
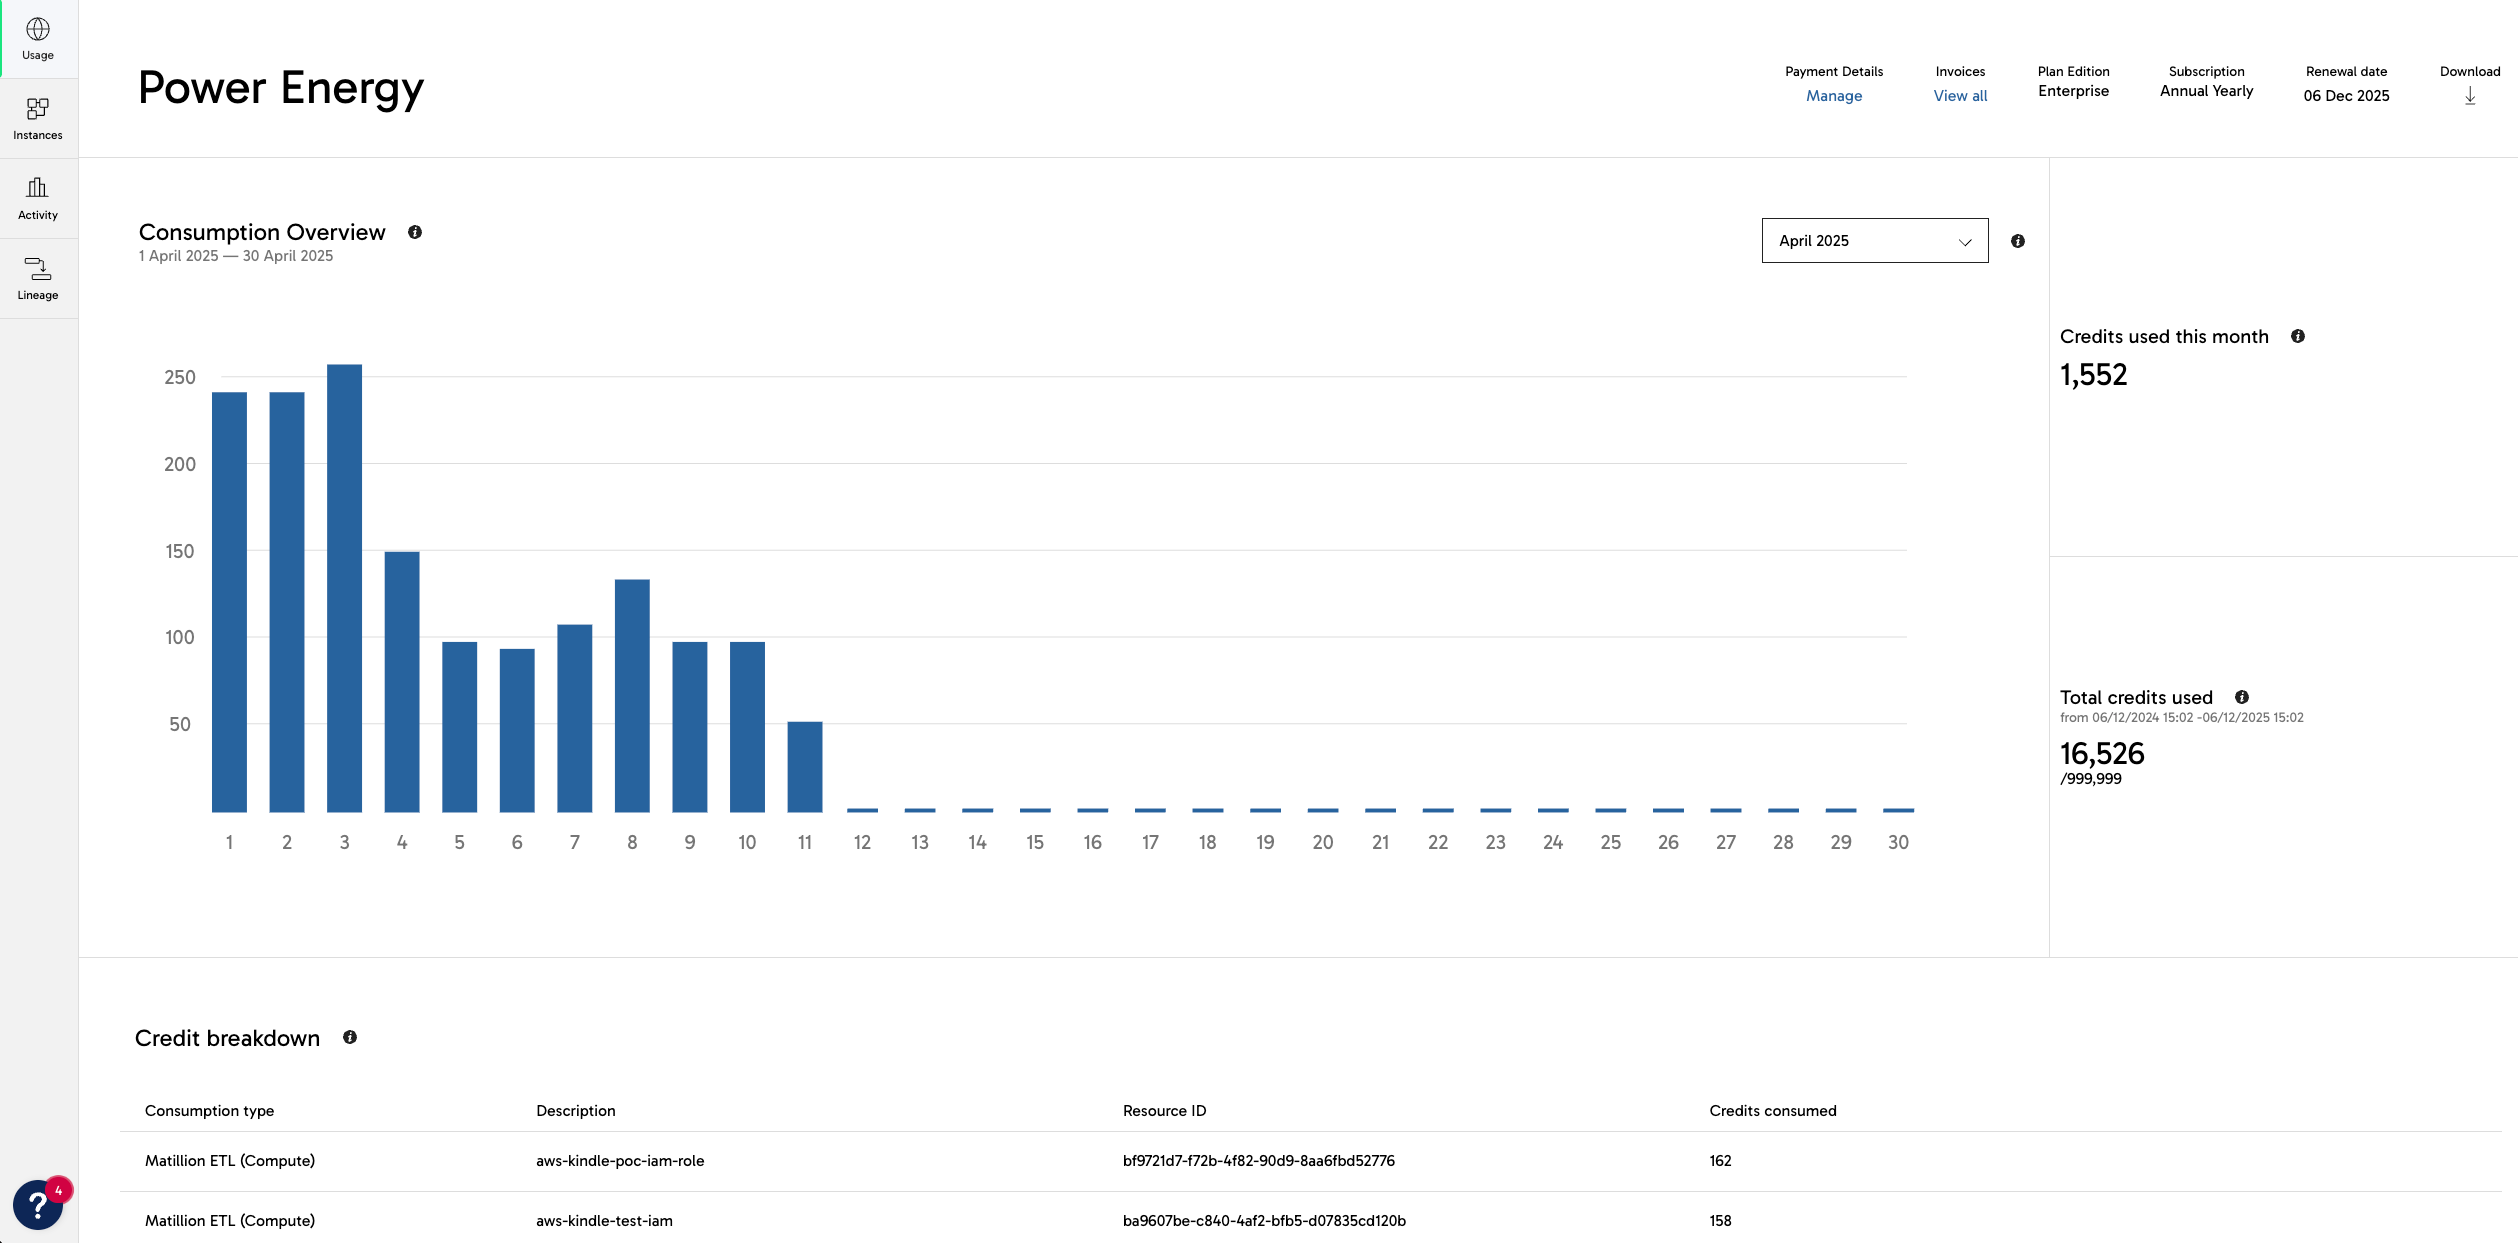
A graphical representation of your daily credit consumption will be displayed below your plan details. Use the billing period drop-down menu above the bar graph to select which month you want to view.
Note
Customers on the trial edition can view how many credits they have used so far. Paying customers can see how many credits they have used each month.
Hover your mouse over the bar chart to reveal your daily credit consumption.
Credit allowances🔗
Contracted customers can view their total usage across the duration of their contract. You can view your credit allowances, and you can view how many of those credits have been consumed since the beginning of your contract.
To view the total number of credits you have consumed during this period of your contract, look to the right of the graphical representation of your daily credit consumption.
Credit breakdown🔗
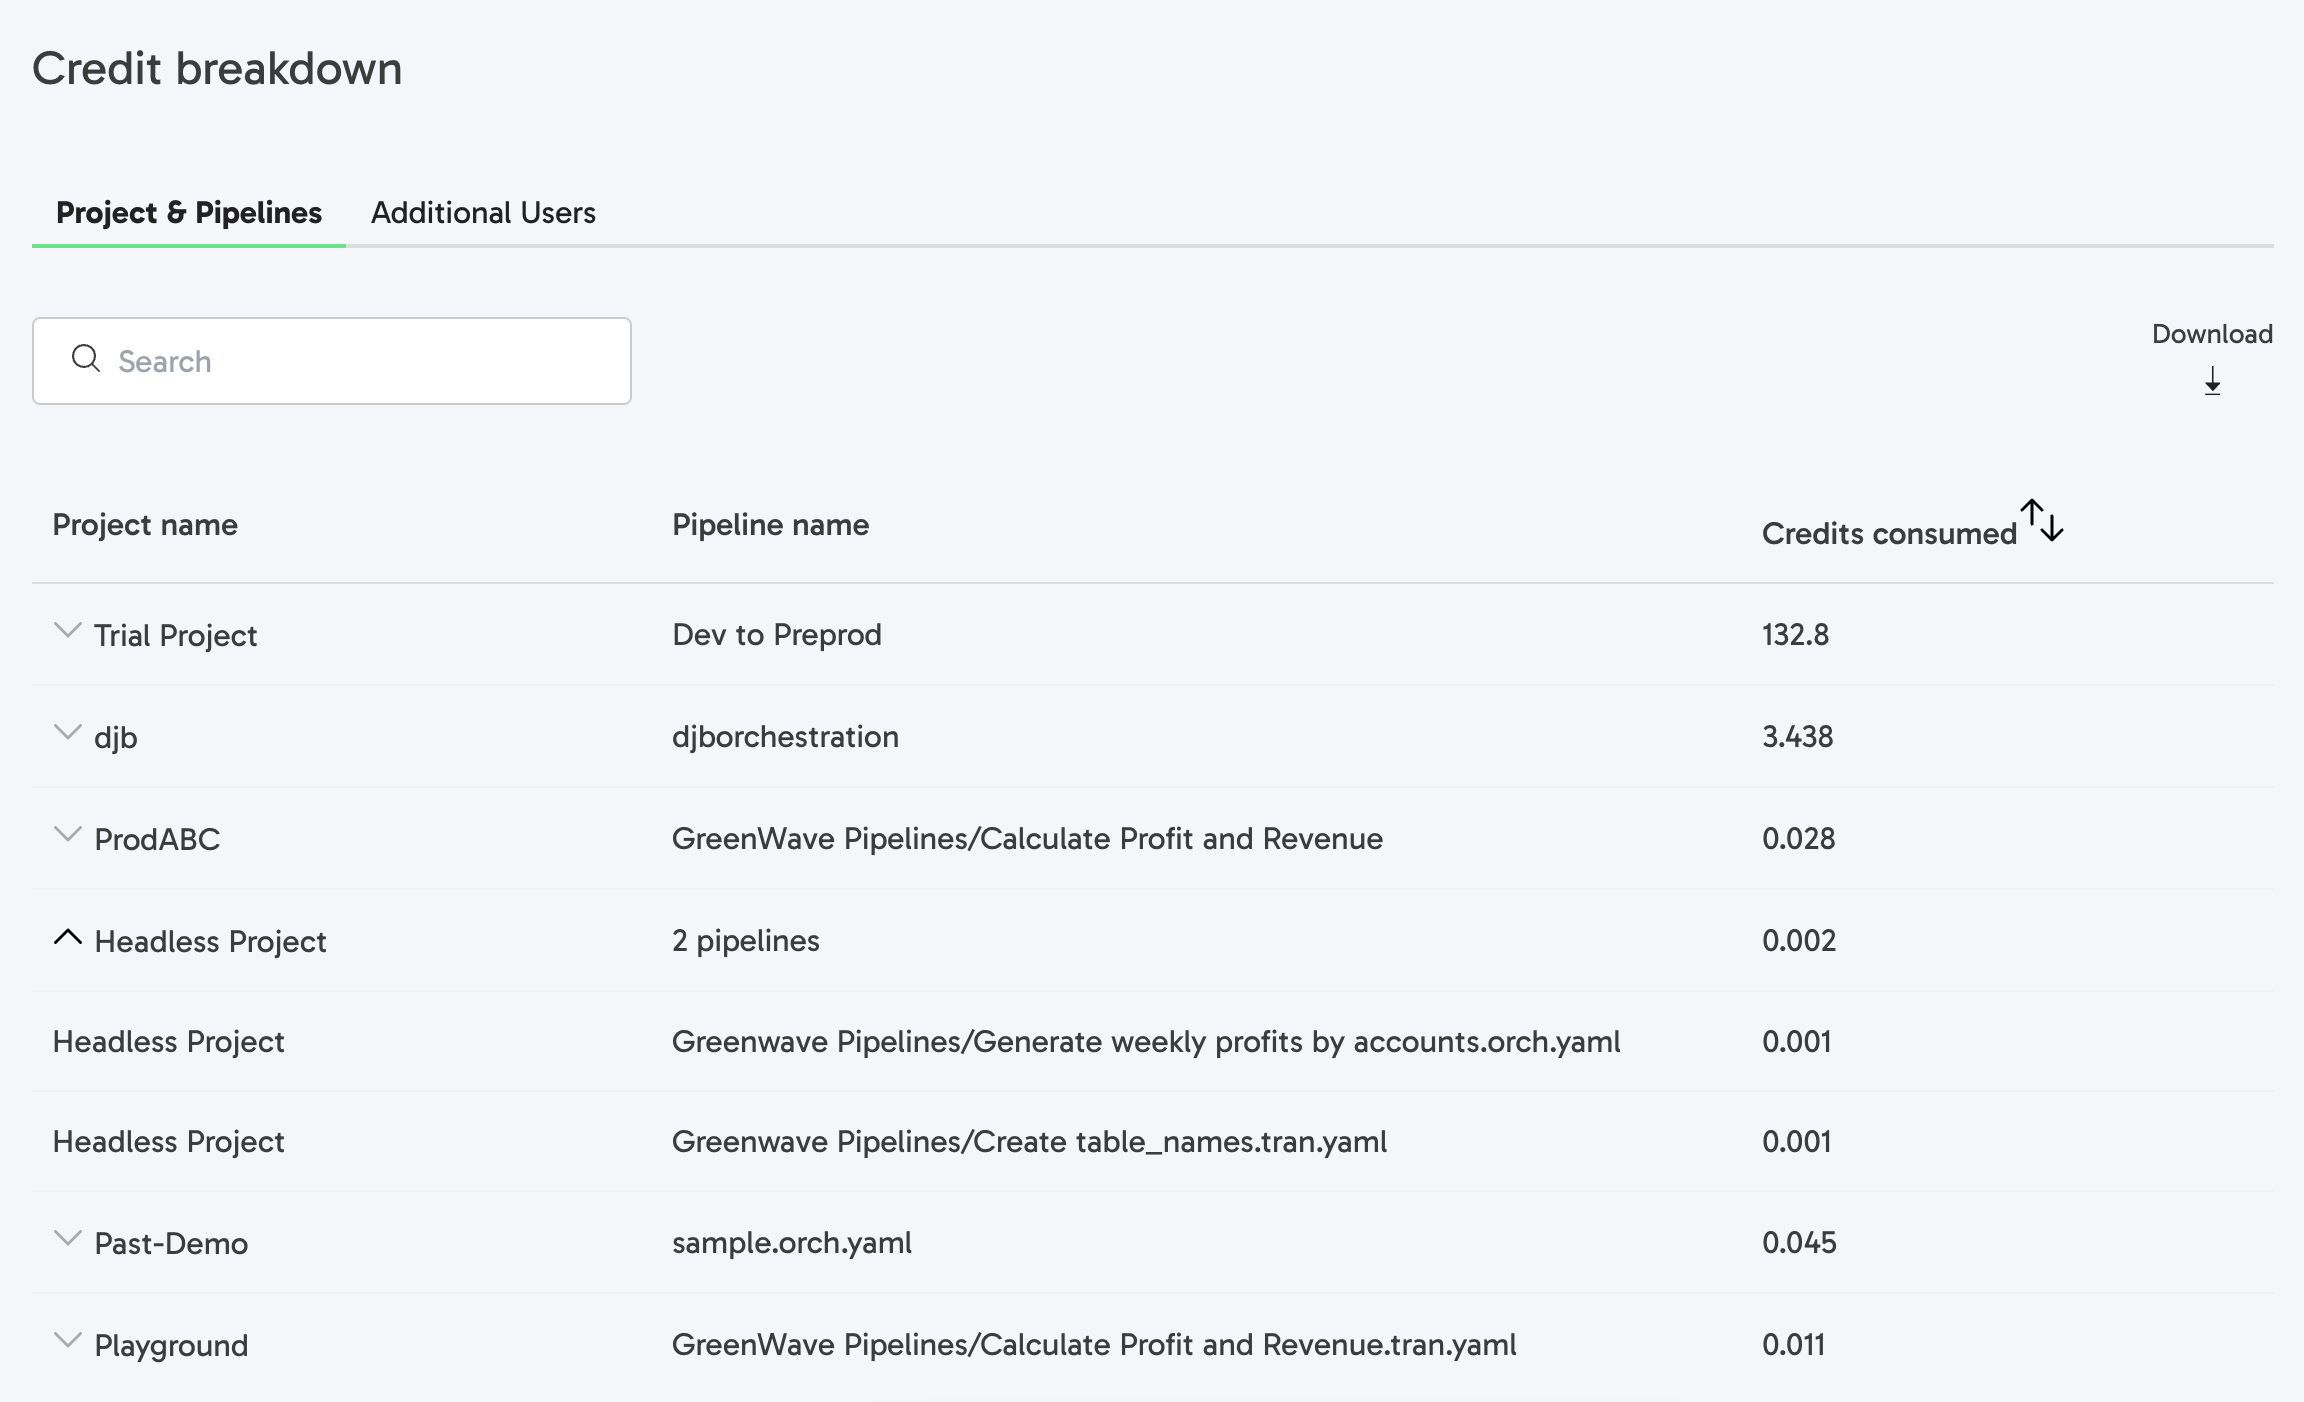
The credit breakdown table provides a granular view of your credit usage, detailing the total credits consumed within the specified month, typically displayed at the project and/or pipeline level. You can observe where costs are accruing.
By segmenting the data, you can identify how many credits each project (or specific pipelines) are consuming, enabling better resource management, optimization of workflows, and accurate internal cost allocation. You can download a CSV for each tab, or the data is also available via the Consumption API for further reporting.
