CDC pipeline detailed view🔗
You can access a detailed view for each pipeline on your dashboard, which displays useful information, configuration settings, and performance data. The dashboard is read-only; there is no option to edit any of the presented information.
Open the detailed view for a pipeline by clicking the pipeline's name on the Pipelines dashboard.
Pipeline details🔗
Refer to the following table for a description of each component of the pipeline detailed view.
| Page component | Title | Description |
|---|---|---|
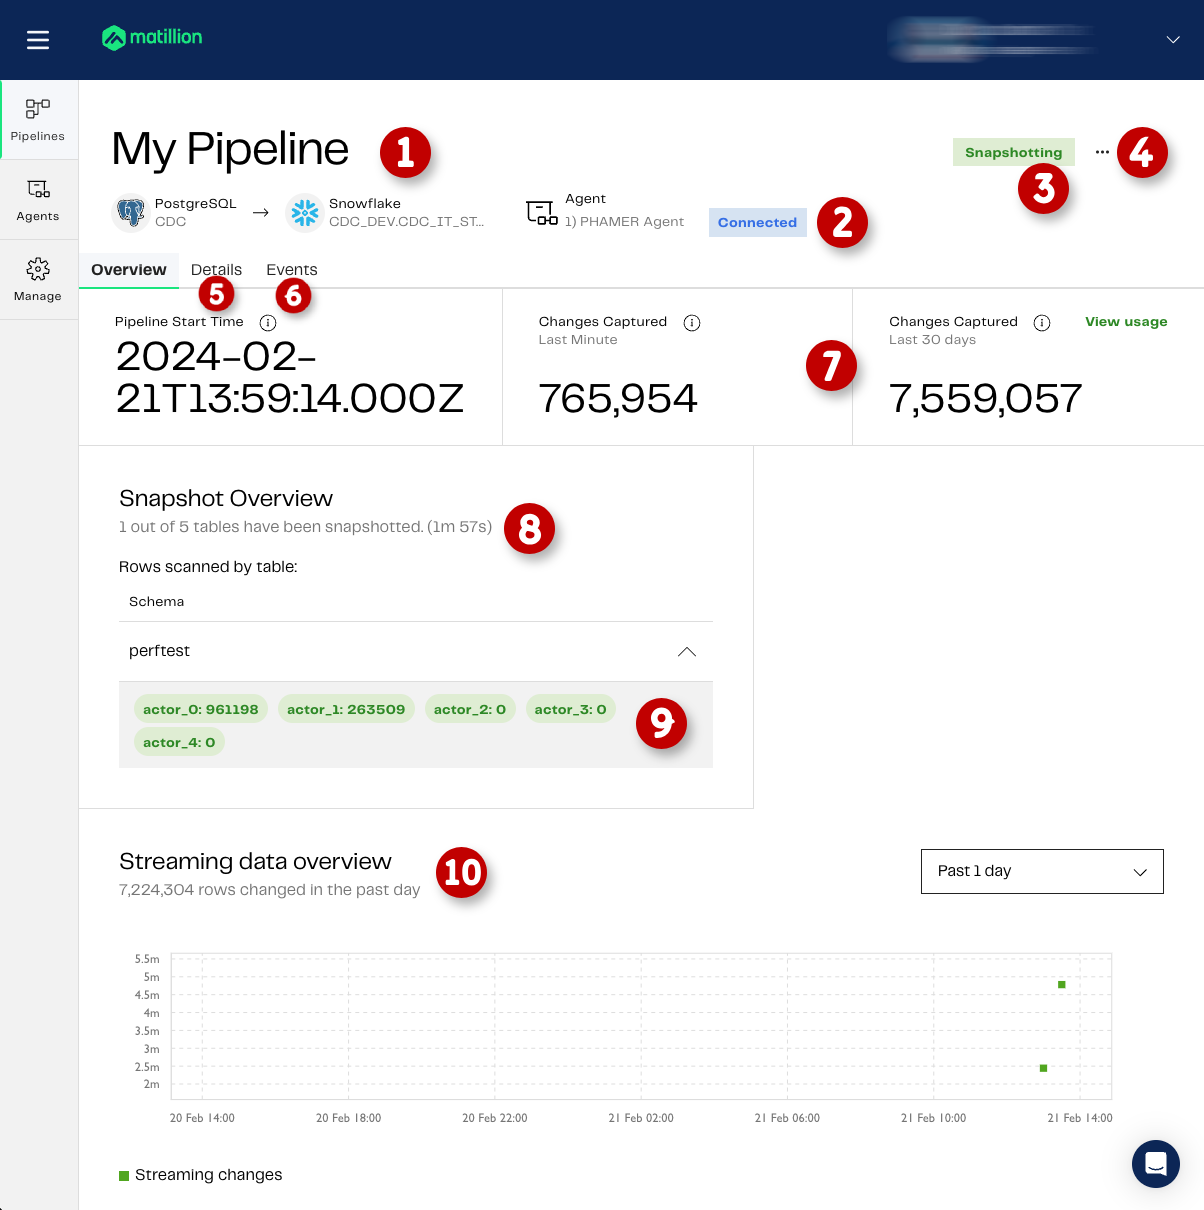
| 1 | Summary details | The top of the screen shows the pipeline's Name, Source, Destination, and Agent. |
| 2 | Agent status | Displays the current status of the CDC agent. See Status details, below. |
| 3 | Pipeline status | Displays the current status of the pipeline. See Status details, below. |
| 4 | Actions | Click the three dots ... to see actions you can perform on the pipeline. You can Start or Stop the pipeline (if the pipeline is in an appropriate status), or Delete the pipeline. Deleting a pipeline is permanent and can't be reversed. |
| 5 | Details | Displays the Pipeline Summary page, which contains an overview of the pipeline configuration settings. This page is also displayed at the end of the pipeline creation process. See Details, below. |
| 6 | Events | Shows the date and time of each occasion the pipeline started and stopped. Where the pipeline stopped as the result of an error, you can expand the log entry to view details of the error. You can choose to receive email notification each time the pipeline fails due to an error. See Events, below. |
| 7 | Changes Captured | The total number of changes captured over two different timescales. This includes snapshots plus individual inserts, updates and deletes, and will automatically update. Click View usage to go to your Account Usage page on the Matillion Billing Platform. |
| 8 | Snapshot Overview | This section is displayed only when a Snapshot is currently running, and will give you a high level description of the progress of the snapshot. The details will automatically update. |
| 9 | Snapshot Table Details | If you expand a schema that is part of the currently running snapshot you will see a list of the tables being snapshotted, and the rows processed so far. The details will automatically update. |
| 10 | Streaming data overview | Displays a graphical representation of the total number of rows inserted, updated, or deleted over a given period. Use the drop-down on the right to change the period to one hour, one day (the default), seven days, or 30 days. |
Status details🔗
The CDC agent status displayed on this page will be one of the following:
- Disconnected: The CDC agent is not connected to Matillion's servers.
- Connected: The CDC agent is connected to Matillion's servers.
The pipeline status displayed on this page will be one of the following:
- Not running: The pipeline is stopped.
- Snapshotting: The pipeline is performing a snapshot to get the initial database state required for CDC to start.
- Streaming: The pipeline is streaming change records to cloud storage.
- Unavailable: The CDC agent cannot be reached, therefore the pipeline status is unknown.
Details🔗
The summary is divided into the following sections:
- Agent Details
- Source Details
- Selected Tables
- Destination Details
- Pipeline Settings
This page is also displayed at the final stage of the pipeline creation process. See CDC Pipeline UI for more information.
Events🔗
The Alerts section allows to you enable email notifications whenever the pipeline stops due to a failure. This option is disabled by default. Switch the toggle to Yes to enable this feature.
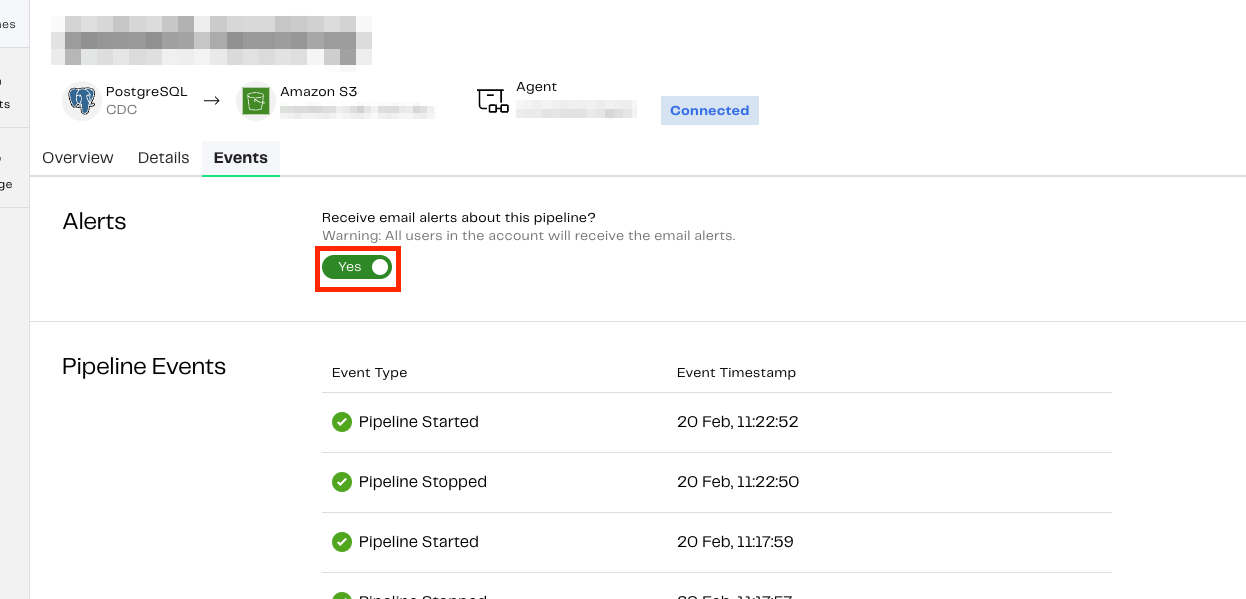
The Pipeline Events section shows a log of each time the pipeline was started and stopped. Successful events are highlighted with a green tick, failures with a red X. Where a failure has occurred, you can expand the entry to view the error code.