Pivoting and unpivoting tables🔗
Pivoting Data
System databases can often hold data in a highly normalised form such as the below:
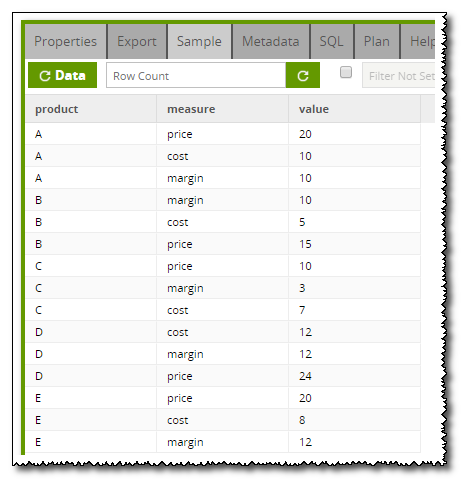
However this format is not so user friendly and is not ideal for an end user BI tool. The Transpose Rows Component can be used with the Split Field Component to pivot the data. The Transpose Rows Component works by aggregating columns with a given delimiter. In this case the value column is aggregated after the data is sorted by the measure column. The sort on the measure column is important to ensure that you know which value relates to which measure once it has been aggregated:
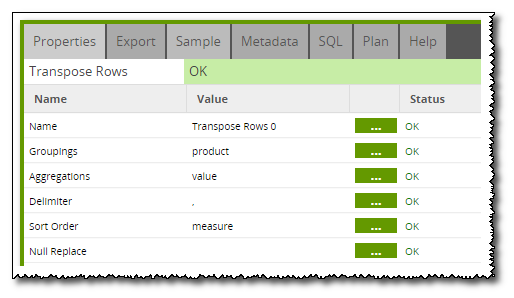
The Transpose Rows Component is calling the Redshift LISTAGG function to create one column with all values in:
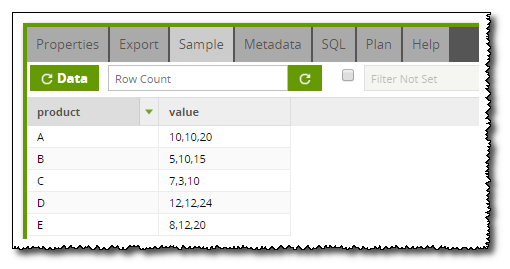
These values can be separated out into separate columns using the Split Field Component:

For this example, the value field is split into 3 new columns using the same delimiter as specified in the Transpose Rows Component earlier:
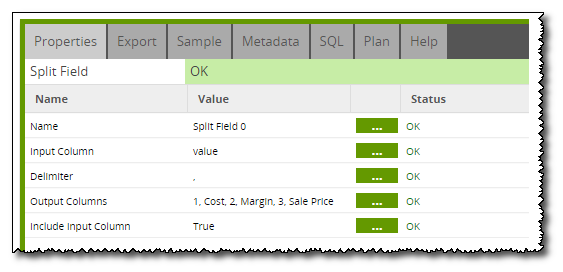
Note in order for this to work correctly, one row must exist per Sort Order column values.
Unpivoting Data
Similarly to the above, it may be necessary to unpivot data and this can be done using the Transpose Columns Component in Matillion ETL. Taking the example with the products:
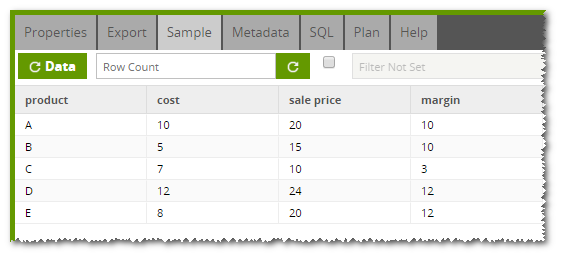
In order to convert the cost, sale price and margin into separate rows, two new columns needs to be created to hold the measure name (i.e. cost, sales price and margin) and the values of these measures. This is the Row Label Name and Output Column respectively in the Transpose Columns Component:
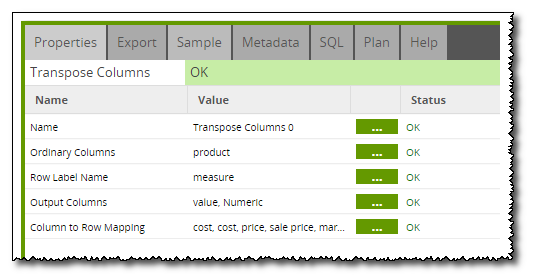
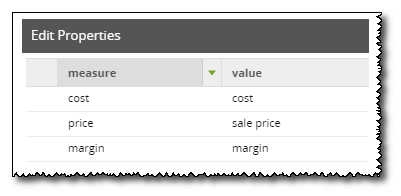
Finally a mapping needs to be created to instruct Matillion ETL which row relates to which measure:
Unpivoting from a concatenated field with variable contents
The unpivot example above is fairly simple as there were always 3 fixed columns to produce 3 new rows of data from. However, it is possible to unpivot rows of data where all of the data is held in one column of variable length.Taking the below example of data which gives the price a product has been sold at on a number of occasions:
| Product | Sales Price |
| A | 10, 11, 12, 10, 7, 8, 9, 10, 10, 11, 10, 12, 12, 11, 10 |
| B | 5, 6, 5, 4, 5, 6 |
| C | 8, 9, 9, 8, 7, 7, 5, 5, 9 |
The first step in unpivoting this data is to separate out the sales prices into different columns. This is done using the Split Field Component. In order for this to work, the maximum number of columns need to be given.
After splitting the fields into columns, the data looks like the below:
